1993—2013年中国发电情况一览表
参赛者:聂虹、苏煜雅、倪晨羚、杨静
院校:南京大学

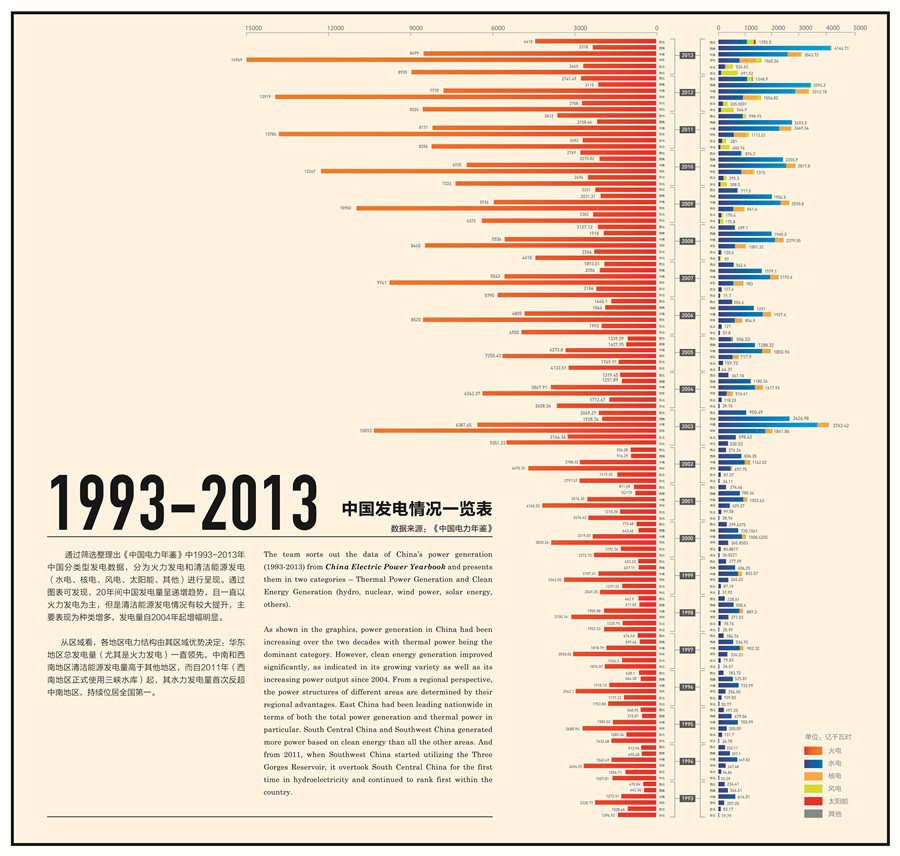
本小组筛选整理出《中国电力年鉴》中1993-2013年中国分类型发电数据,分为火力发电和清洁能源发电(水电、核电、风电、太阳能、其他)进行呈现。通过图表可发现,20年间中国发电量呈递增趋势,且一直以火力发电为主,但是清洁能源发电情况有较大提升,主要表现为种类增多,发电量自2004年起增幅明显。
从区域看,各地区电力结构由其区域优势决定:华东地区总发电量(尤其是火力发电)一直领先,中南和西南地区清洁能源发电量高于其他地区,而自2011年(西南地区正式使用三峡水库)起,其水力发电量首次反超中南地区,持续位居全国第一。
The team sorts out the data of China’s power generation (1993-2013) from China Electric Power Yearbook and presents them in two categories – Thermal Power Generation and Clean Energy Generation (hydro, nuclear, wind power, solar energy, others).
As shown in the graphics, power generation in China had been increasing over the two decades with thermal power being the dominant category. However, clean energy generation improved significantly, as indicated in its growing variety as well as its increasing power output since 2004. From a regional perspective, the power structures of different areas are determined by their regional advantages. East China had been leading nationwide in terms of both the total power generation and thermal power in particular. South Central China and Southwest China generated more power based on clean energy than all the other areas. And from 2011, when Southwest China started utilizing the Three Gorges Reservoir, it overtook South Central China for the first time in hydroelectricity and continued to rank first within the country.
